
Priscilla Vance runs maintenance for a bottling plant outside Boise, Idaho. Forty-one people on her crew, three shifts, and a filling line that’s older than half of them. Last October a vibration sensor on line two started throwing odd readings — nothing dramatic, just a slow drift nobody caught for six weeks. Then a bearing seized at 2 a.m. on a Saturday. Nine hours down. A pallet of product scrapped. Priscilla still has the maintenance log from that week taped inside her clipboard, just so she doesn’t forget what “we’ll get to it later” actually costs.
That’s the story behind most sensor data analytics projects. Not some abstract digital transformation slide deck. A bearing. A drift nobody flagged. A Saturday nobody wanted.
Sensors have been bolted onto machines, trucks, and buildings for years now. Cheap ones too — a decent vibration sensor runs less than a night out. The hard part was never getting the readings. It’s turning raw sensor readings into something a plant manager in Boise, a fleet dispatcher in Tucson, or a hospital ops director in Cleveland can actually act on before the bearing seizes, not after.
A real sensor data analytics strategy for 2026 has to answer three plain questions: what are we measuring, where does it get processed, and who actually sees the alert in time to do something about it. Everything else — the architecture diagrams, the vendor comparisons, the machine learning models — is just plumbing underneath those three questions.
Priscilla’s plant survived the bearing failure. Plenty of operations don’t survive the third or fourth one before someone upstairs starts asking pointed questions about why nobody saw it coming.
Sensor data analytics is the practice of collecting readings from physical devices — temperature sensors, pressure sensors, motion sensors, GPS sensors, lidar, cameras, whatever’s relevant to the equipment — and running them through a pipeline that cleans, stores, and interprets them well enough for a human or an algorithm to make a call. That’s sensor data analysis in one sentence. The “system” part is everything that has to exist for that sentence to hold true at scale: sensor equipment, a connectivity layer, storage, processing, and a way to get an alert to the right inbox or dashboard before it’s useless.
IoT sensor analytics is the same idea applied to networked devices talking over Wi-Fi, cellular, LoRaWAN, or a wired backbone rather than sitting on an isolated instrument panel. Most 2026 deployments are IoT by default — the sensors are connected, the gateway is somewhere between the shop floor and the cloud, and the whole point is real-time sensor data analysis rather than a technician manually logging numbers on a clipboard once a shift.
Every sensor analytics architecture, no matter the industry, breaks into three layers. Miss one and the whole strategy wobbles.
The sensor equipment layer. This is sensor placement, sensor positioning, sensor accuracy, and sampling rate — the physical, unglamorous stuff. A temperature sensor bolted three feet from where the actual heat load sits gives you clean, confident, completely wrong numbers. Sensor calibration belongs here too, and it’s the single most skipped step in rushed rollouts.
The connectivity layer. How readings get from the device to somewhere useful. LPWAN and LoRaWAN for long-range, low-power industrial and agriculture sites. 5G or cellular connectivity where latency actually matters — autonomous vehicles, remote patient monitoring. MQTT and OPC UA as the protocols doing the actual talking. Bandwidth optimization and network latency decisions get made here, and they quietly determine whether “real-time” is true or just marketing.
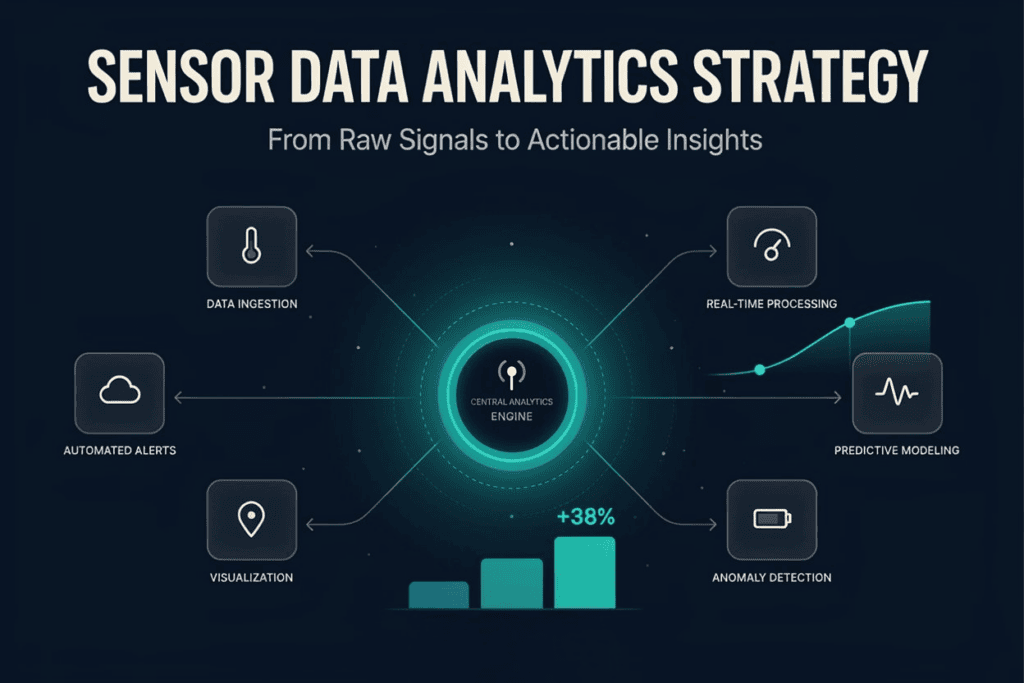
The data analytics layer. Ingestion, cleaning, storage, feature extraction, modeling, and the dashboard someone actually opens. This is where sensor data analytics services firms like AsappStudio’s IoT development team spend most of their build time, because it’s where a pile of raw sensor readings becomes a threshold alert, a predictive maintenance flag, or a trend line a plant manager trusts enough to act on.
| Layer | What Lives Here | Common Failure Point |
| Sensor equipment | Placement, calibration, sampling rate, ruggedized hardware | Wrong sensor type or bad placement skews everything downstream |
| Connectivity | LPWAN, 5G, MQTT, gateways, bandwidth planning | Intermittent connectivity silently drops readings |
| Data analytics | Cleaning, storage, feature extraction, modeling, dashboards | Skipping preprocessing, so noise gets modeled as signal |
Data acquisition sounds simple until you’re pulling from forty sensors with forty slightly different clocks. Timestamp synchronization matters more than most teams expect — two readings that look simultaneous but aren’t will wreck a correlation analysis without anyone noticing for months.
Sensor data cleaning covers a specific, unglamorous list: missing sensor data, noisy sensor data, duplicate readings, corrupted sensor readings from faulty hardware, and outliers that are either a real event or a bad connector — you don’t always know which until you dig. Standard sensor data preprocessing techniques include median filtering and moving average filters for noise reduction, linear or spline interpolation for missing-value imputation, and outlier detection to flag readings that don’t belong.
Sensor drift is its own beast. A sensor doesn’t fail outright most of the time — it drifts, slowly, until its readings are technically “working” but quietly wrong. Drift correction usually means comparing against a reference sensor or a scheduled recalibration cycle. Skip it, and your anomaly detection model eventually learns to treat the drift itself as normal, which defeats the entire point.
Data validation and schema validation catch structural problems — a sensor reporting Fahrenheit when the pipeline expects Celsius, a field silently going null. Sensor data quality control isn’t a one-time cleanup pass. It’s a running discipline, closer to sensor data observability than a checklist you finish and forget.
This question comes up in nearly every sensor analytics consulting conversation, and the honest answer is “it depends on your latency tolerance,” which frustrates people who want a clean rule.
Edge processing for sensor data makes sense when a decision has to happen in milliseconds — a robotic arm reacting to a proximity sensor, an autonomous vehicle reading lidar and radar sensors in real time. Local processing near the device avoids the round trip to the cloud entirely.
Cloud sensor data processing wins when you need heavy compute, historical modeling across months of data, or a centralized view across hundreds of sites. Cloud data warehouses and time-series databases handle the volume better than anything sitting on a gateway.
Hybrid sensor data processing is where most serious 2026 deployments actually land. Filter and flag critical events at the edge — a vibration sensor crossing a hard threshold shouldn’t wait on a network round trip. Send everything else to the cloud for trend analysis, model retraining, and long-term storage. Priscilla’s plant runs exactly this pattern now: edge alerts for anything that could stop the line, cloud dashboards for the weekly ops review.
Once sensor data is validated and flowing, the analytics layer does the actual work — and this is where custom IoT analytics solutions earn their keep over off-the-shelf dashboards.
Feature extraction pulls structure out of raw signal: time-domain features like mean, variance, and standard deviation; frequency-domain features via Fourier transform or wavelet decomposition for vibration and acoustic data; rolling statistics and trend detection for slower-moving readings like temperature.
Statistical and machine learning methods get chosen based on the question, not the hype. Regression for forecasting a continuous value. Clustering for grouping similar equipment behavior without predefined labels. Classification for tagging events into known failure categories. Neural networks earn their complexity when the pattern is genuinely nonlinear — vibration signatures ahead of a bearing failure, for instance — not by default.
Anomaly detection and sensor fusion — combining readings from multiple sensor types, say temperature plus vibration plus current draw — cut down false-alert reduction dramatically compared to any single sensor working alone. A temperature spike by itself might be nothing. A temperature spike plus a vibration anomaly at the same timestamp is usually something.
Predictive maintenance is the highest-ROI use case across industrial and manufacturing analytics, and it’s the direct answer to Priscilla’s Saturday-night problem: catch the drift six weeks earlier, schedule the bearing swap during a planned Tuesday shutdown instead of an unplanned Saturday one.
Every one of these shares the same backbone: hardware input collection, a connectivity layer, and an analytics layer that turns telemetry into a decision somebody actually makes.
Implementation timelines vary widely depending on sensor count and integration complexity, but a focused pilot for a single production line or fleet segment is a realistic starting scope before a full rollout. Sensor analytics implementation cost tends to track closely with how much custom integration work the existing equipment requires — legacy machinery without any digital interface costs more to instrument than newer equipment with built-in connectivity.
This is exactly the kind of work our team handles end to end — from defining sensor requirements through to a working IoT development build with real dashboards and real alerts. When a project calls for predictive models or anomaly detection tuned to your specific equipment, our artificial intelligence team builds and validates those models against your actual sensor history, not a generic dataset. The surrounding platform — ingestion pipelines, dashboards, integrations with whatever ERP or CRM you’re already running — comes out of our broader software development practice, and every build goes through our quality assurance process before it touches a production line. If your internal team needs extra hands rather than a full outsourced build, our staff augmentation option plugs experienced engineers directly into your existing workflow. Take a look at our case studies or book a consultation to talk through what a sensor analytics strategy would look like for your operation.
1. What is sensor data analytics?
It’s collecting, cleaning, and interpreting readings from physical sensors so teams can catch problems and make decisions in real time.
2. Should sensor data be processed at the edge or in the cloud?
Use edge for split-second decisions, cloud for deep historical analysis. Most 2026 builds use both in a hybrid setup.
3. How much does sensor data analytics implementation cost?
It depends on sensor count, existing equipment, and integration complexity. Legacy machinery without connectivity costs more to instrument.
4. How do you handle missing or noisy sensor data?
Use filtering, interpolation, and outlier detection during preprocessing, plus ongoing validation to catch drift before it skews results.
5. What industries benefit most from sensor data analytics?
Manufacturing, logistics, healthcare, agriculture, and energy see the fastest returns, mainly through predictive maintenance and real-time monitoring.